Pi Cycle Top Indicator: How Close Is #BTC to Its Peak? H...
March 28, 2025•3,046 lượt xem
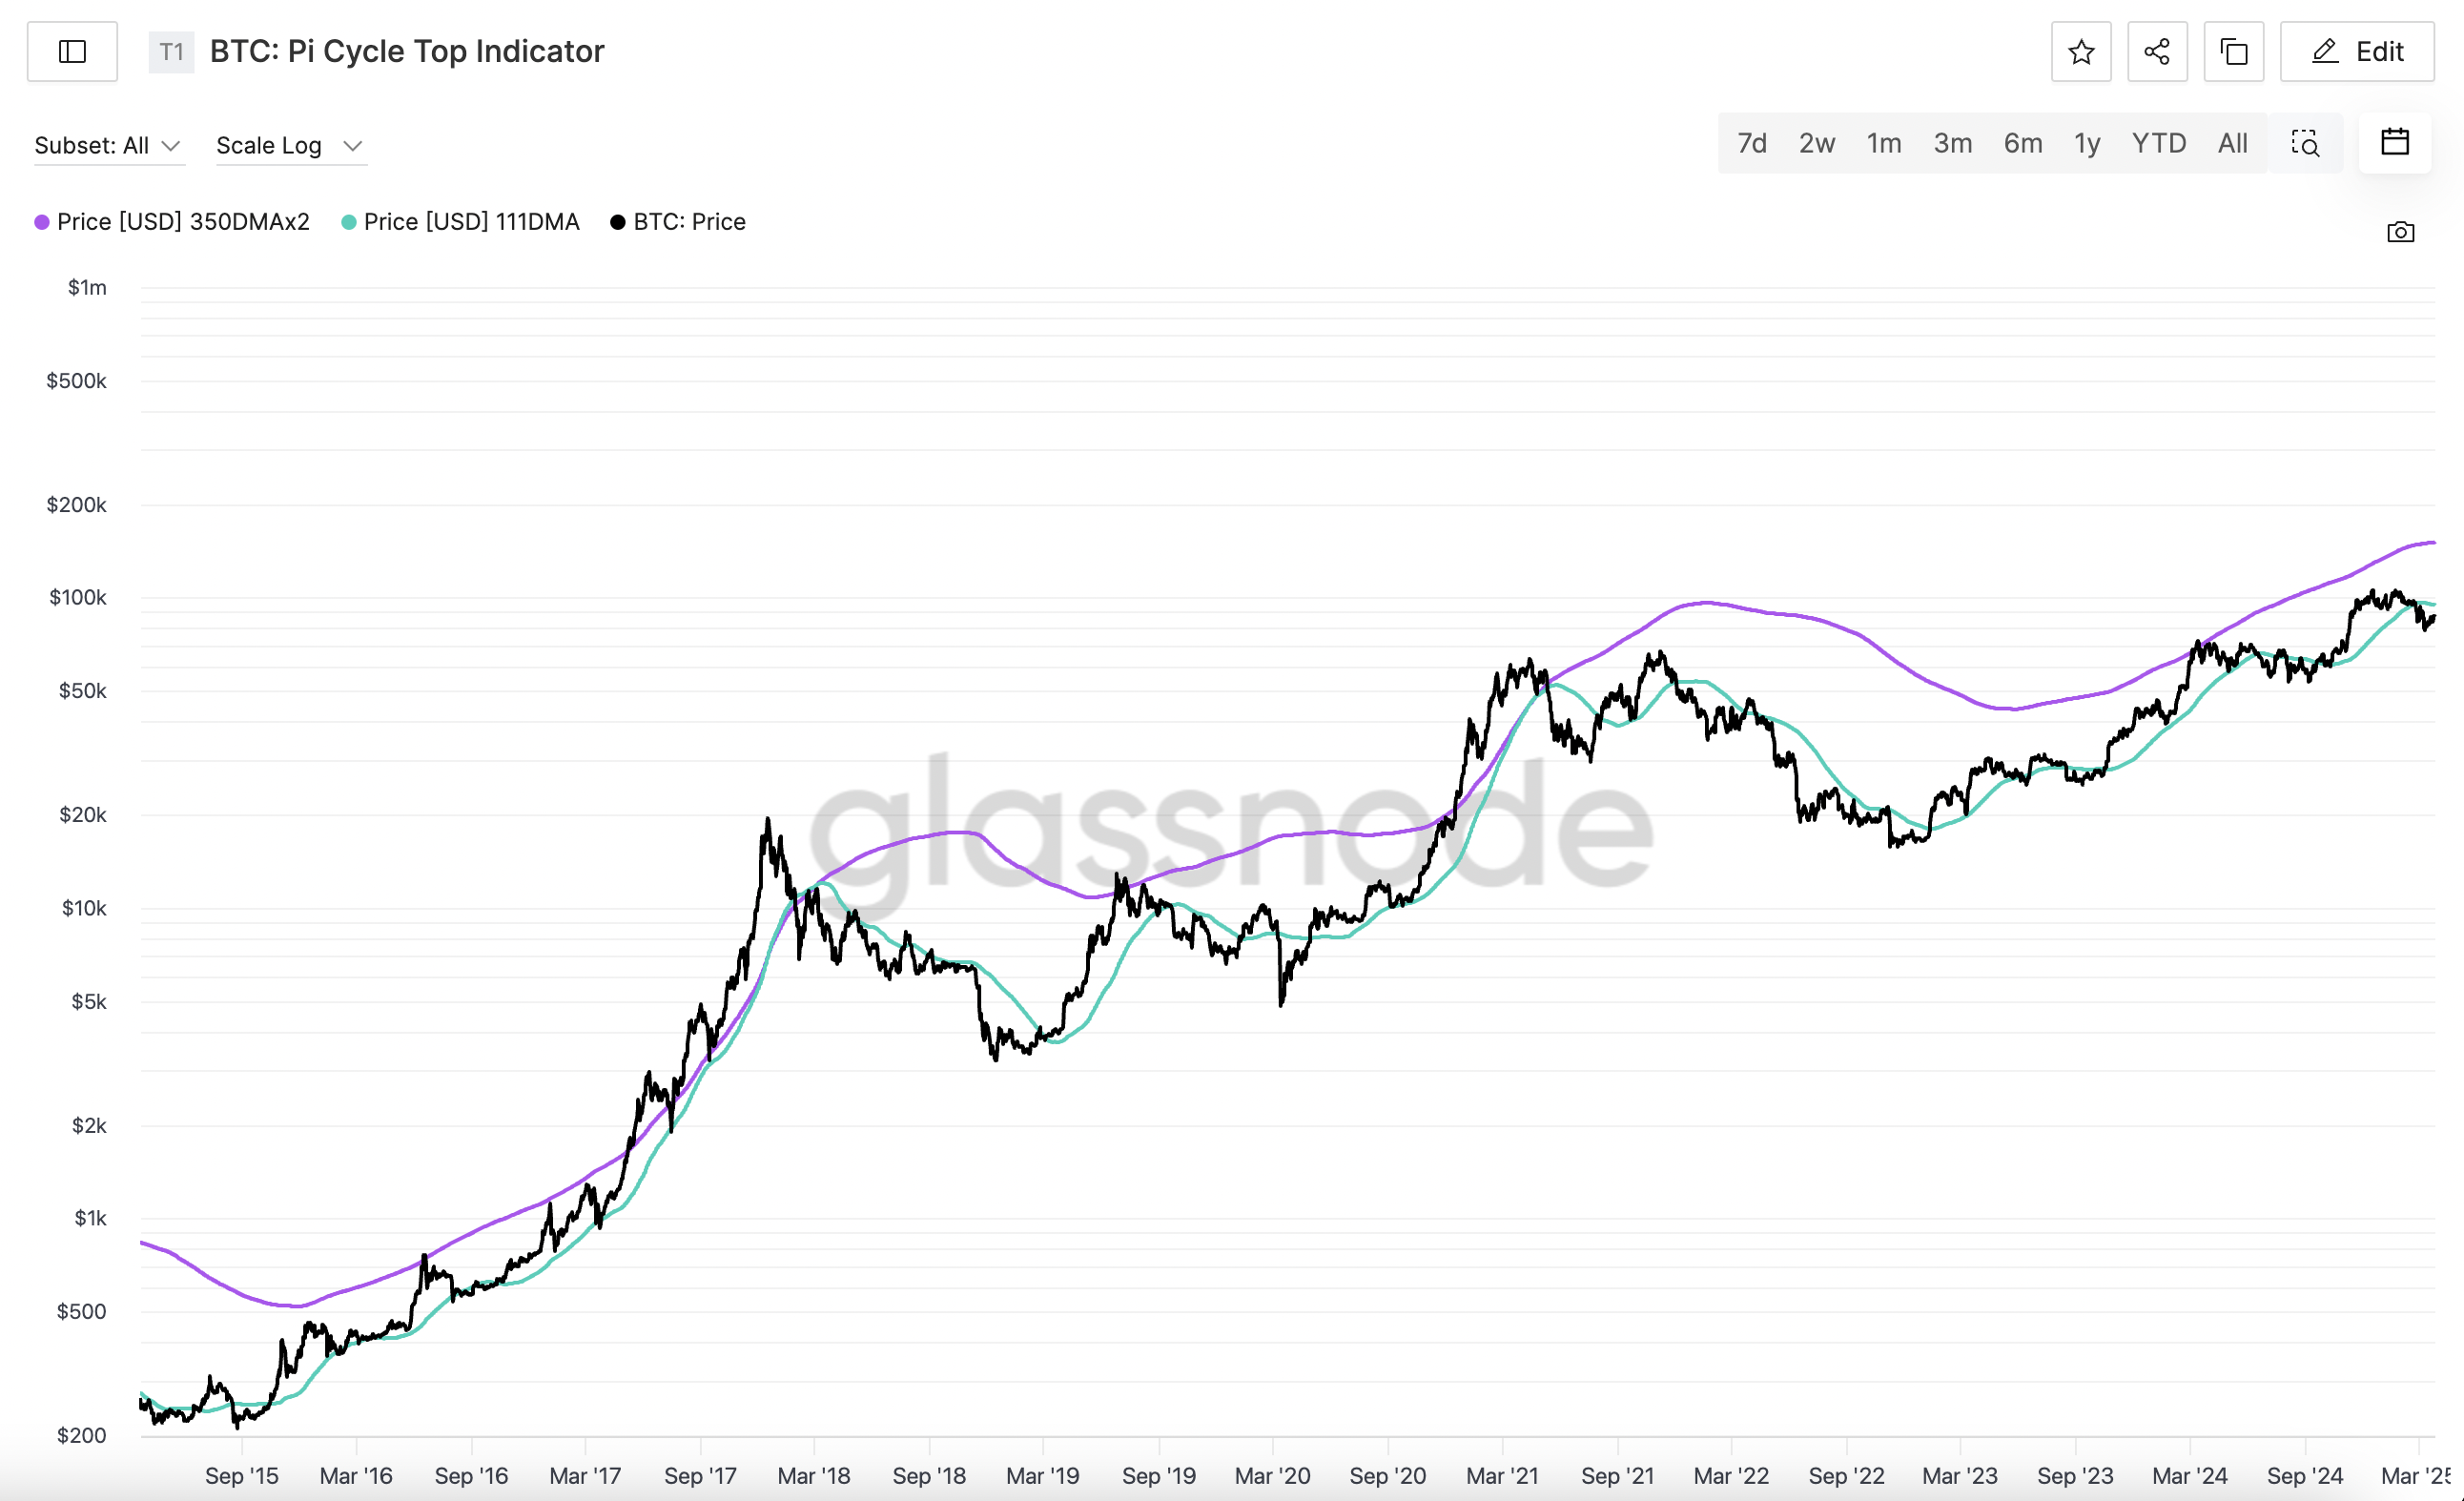
Pi Cycle Top Indicator: How Close Is #BTC to Its Peak? Historically, the Pi Cycle Top Indicator has been quite accurate in predicting #Bitcoin bull cycle tops. The chart shows that the key lines — the 111-day (blue) and the 350-day doubled (purple) moving averages — have intersected near market peaks. 🔹 Current Observations: ✅ $BTC continues to rise, but the indicator lines have not yet crossed ✅ In previous cycles, price peaks occurred when these lines converged ✅ The historical pattern suggests that the final phase of growth may still be ahead ❓ What’s Next? If the indicator confirms the trend, we could see Bitcoin’s final rally before a correction begins. Keeping an eye on these moving averages! 🚀 #BTC Price Analysis#